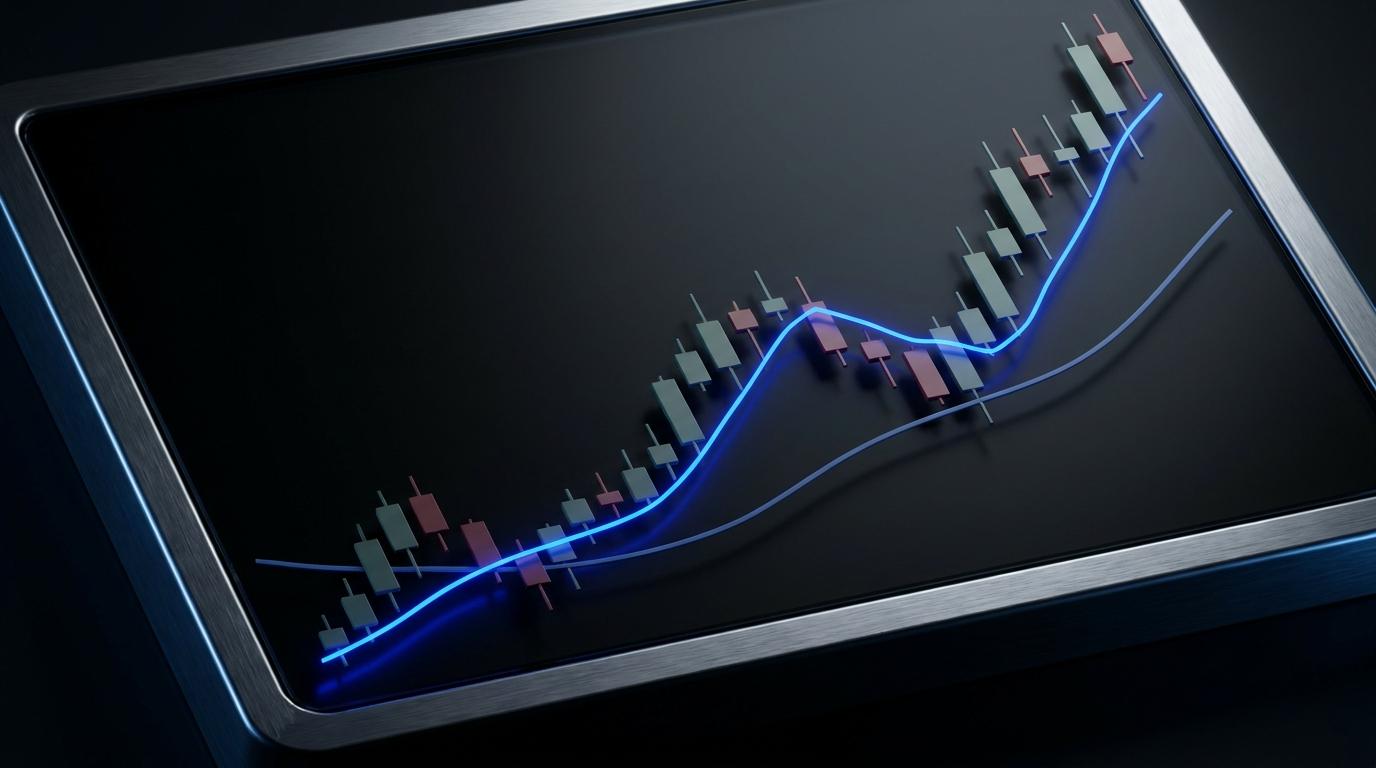
You drop a 20 period average on a chart and the platform asks a question you may never have thought hard about: simple or exponential? Both draw an average of recent price. The difference is how much say the last few candles get. That's the whole of EMA vs SMA, and it decides how fast your line turns, how often it fakes you out, and whether it sits where other people are watching.
Moving averages are the foundation most chart work is built on, and the rest of technical analysis — trend lines, breakout levels, momentum oscillators — tends to lean on them in some way. So it's worth understanding what each version actually measures before you pick one and build rules around it.
What a moving average does
A moving average takes the closing prices of the last X bars, averages them, and plots the result. On the next bar it does it again with a new window. The line that comes out strips away a lot of the noise in individual candles and leaves you with the direction price has been leaning.
That's the real job: a moving average is a trend filter, not a prediction. It tells you where price has been relative to its own recent history. Every moving average lags, because every one of them is built from prices that already happened. The only question is how much lag you're willing to accept in exchange for a smoother line.
How the simple moving average is calculated
The SMA is plain arithmetic. Add the closing prices of the last X bars and divide by X. A 10-period SMA on a daily chart of MSFT is the sum of the last ten daily closes divided by ten. Every close in that window counts exactly the same, whether it happened yesterday or two weeks ago.
That equal weighting creates a quirk worth knowing about. When a new bar enters the window, an old bar drops out — and if the bar dropping out was an unusual one, the SMA can move sharply even on a quiet day. A big gap from ten sessions ago can push the line around today, purely because it left the calculation.
How the exponential moving average is calculated
The EMA weights recent prices more heavily and lets older prices fade out instead of dropping off a cliff. It's calculated from the previous period's EMA plus a fraction of the gap between that value and the current close. Fidelity's technical indicator guide writes it as EMA = (K x (C − P)) + P, where C is the current price, P is the previous EMA and K is the smoothing constant.
K comes from the period you choose: 2 divided by the number of periods plus one. A 20-period EMA uses roughly 0.095, so each new close pulls the line about 9.5% of the way toward itself. Shorter periods mean a bigger K and a line that snaps to price. Nothing ever truly leaves an EMA's memory — old data just gets less and less influence as it ages.
EMA vs SMA: the differences that matter
SMA | EMA | |
|---|---|---|
Weighting | Every bar counts equally | Recent bars count more |
Lag | More | Less |
Reaction to a gap or spike | Spread across the whole window | Immediate, then fades |
Drop-off effect | Yes — old bars leaving can move the line | No |
False signals | Fewer | More |
Typical use | Longer-term trend, widely watched levels | Short-term momentum, intraday work |
Put a 50-period SMA and a 50-period EMA on the same NVDA chart and they'll track each other closely most of the time. The gap shows up at turns. After a sharp two-day reversal, the EMA has already rolled over while the SMA is still pointing the old way. If the reversal was real, the EMA got you there first. If it was a shakeout, the EMA whipsawed you and the SMA kept you in the trade.
Neither outcome is a property of the indicator. It's a property of the market you're trading that week. The EMA trades accuracy for speed; the SMA trades speed for stability.
Picking a period
The period you choose changes the character of the line far more than the EMA/SMA decision does. A few conventions that show up on most charts:
- 9 and 21: fast intraday lines, usually run as EMAs. They hug price on a 1- or 5-minute chart and are used to define short-term momentum.
- 20: the standard "recent trend" setting on a daily chart, and the center line of Bollinger Bands.
- 50: the medium-term trend. Often drawn as an SMA because so many desks and screeners use it.
- 200: the long-term institutional line, almost always an SMA. Financial media quote it constantly, which gives it a self-fulfilling quality around round tests.
A useful rule of thumb: the shorter the period, the more sense an EMA makes, because you chose a short lookback for responsiveness in the first place. On the 200-period, the extra responsiveness of an EMA is noise relative to the horizon you're measuring, and the SMA has the advantage of being the version everyone else is watching.
How traders actually use the lines
As a trend filter
The simplest use is directional permission. Price above a rising 50-period line, you only look for longs. Below a falling one, only shorts. This doesn't time anything — it just keeps you from buying calls into a downtrend because a 3-minute candle looked strong.
As dynamic support and resistance
In a healthy trend, pullbacks often stall near a moving average. A QQQ uptrend that keeps bouncing off its 21-EMA on the hourly chart gives you a repeatable place to look for entries, with a clear invalidation if the close breaks through. The line isn't magic; it works because enough participants are watching the same area and the average is where recent buyers sit.
As a crossover signal
When a fast line crosses a slow one, the shift in short-term momentum against the longer trend is what people trade. The 9/21 EMA cross is the intraday version; the 50/200 SMA cross is the headline version. Crossovers are late by construction, and in a range they generate one bad signal after another, so most traders use them to confirm a trend rather than to enter at the turn.
Where moving averages fail
Sideways price action is the enemy. When a stock chops around a level, the average sits in the middle of the range and price crosses it over and over. Every cross looks like a signal and almost none of them follow through. A choppy session in a crypto-linked name like COIN can produce a dozen 9-EMA crosses before lunch.
That's where the cost shows up for options traders in particular. Each whipsaw costs you the spread plus whatever theta burned while you were in the position, and on short-dated contracts that adds up fast. 0DTE options punish indecision harder than anything else on the board, because the premium you're paying for is decaying by the minute while you wait for a signal to resolve.
The practical fix is a second condition. Require that the moving average is actually sloping, not flat. Require that price has closed beyond it rather than just ticked through. Or pair the average with a volume-weighted reference like VWAP, which gives you a sense of where the session's real business has been done instead of just where the closes have averaged out.
EMA vs SMA for options traders
Two things change when the instrument is an option rather than the stock.
First, you're on a clock. A swing trader using a 50-SMA can afford to wait three sessions for the line to confirm. If you're holding weekly calls on SPY, three sessions of lag is a meaningful chunk of the contract's remaining life. Shorter periods and exponential weighting fit the timeframe you're actually trading.
Second, you need the signal to line up with the strike and expiration you picked. A 9/21 EMA cross on the 5-minute chart is a statement about the next hour or two, not the next month. Buying a 30-day contract off a 5-minute signal means you're relying on an edge that expires long before your option does.
Plot both lines for a while and watch which one your entries actually respect. Some traders find the EMA matches how they read momentum; others find the smoother SMA keeps them out of trouble. The honest answer is that it depends on your holding period and your tolerance for being wrong early versus late.
Keeping the drawdown in check
Whipsaws don't just cost a trade. Four or five of them in a row on the same chart is how an account bleeds out, and the damage shows up as maximum drawdown — the peak-to-trough decline that risk rules are built around. Moving average strategies are especially prone to this because the signals keep coming during exactly the conditions where they work worst.
If you're trading an evaluation at a prop firm, that matters more than it would in a personal account, because the loss limit is a hard line rather than a feeling. A system that produces frequent small losses between occasional big trend wins needs position sizing that can absorb the losing stretch without ending the account before the good run arrives.
The mental side is the same problem from another angle. Chasing every cross because you don't want to miss the one that runs is a recipe for over-trading, and understanding your own trading psychology around missed moves tends to improve moving average results more than changing the period ever does.
FAQs
Is the EMA better than the SMA?
Neither is better in the abstract. The EMA reacts faster and suits short holding periods; the SMA is smoother and suits longer ones. Backtests of the two over long samples tend to land in similar territory, with the EMA catching trends earlier and paying for it with more false signals.
Which moving average is best for day trading?
Short exponential averages — commonly 9 and 21 — on 1-, 5- or 15-minute charts. The reasoning is simple: an intraday trade may only last twenty minutes, and a slow average won't have turned by the time you need to be out.
What does the 200-day moving average mean?
It's the average closing price over the last 200 trading sessions, usually calculated as an SMA, and it's treated as the dividing line between long-term uptrend and downtrend. Its influence comes largely from how many people watch it rather than from anything inherent in the math.
Can you use an EMA and an SMA together?
Yes, and plenty of traders do. A common setup pairs a fast EMA for entry timing with a slow SMA as a trend filter, so you only take fast signals that point in the same direction as the longer-term line.
Should the moving average use closing prices or something else?
Closes by default, and that's what nearly every platform plots. Some traders use typical price (high + low + close divided by three) on intraday charts to reduce the influence of a single spiky close, but the difference is usually small compared with changing the period.
The EMA vs SMA choice is worth ten minutes of thought and not much more. Pick the one that matches your holding period, keep the period consistent so you learn how it behaves, and spend the rest of your energy on the things that decide outcomes — where you size, where you're wrong, and how you handle a losing streak. If you want to test a moving average system under defined risk and get paid on what it produces, our evaluation plans are built for exactly that kind of structured practice.