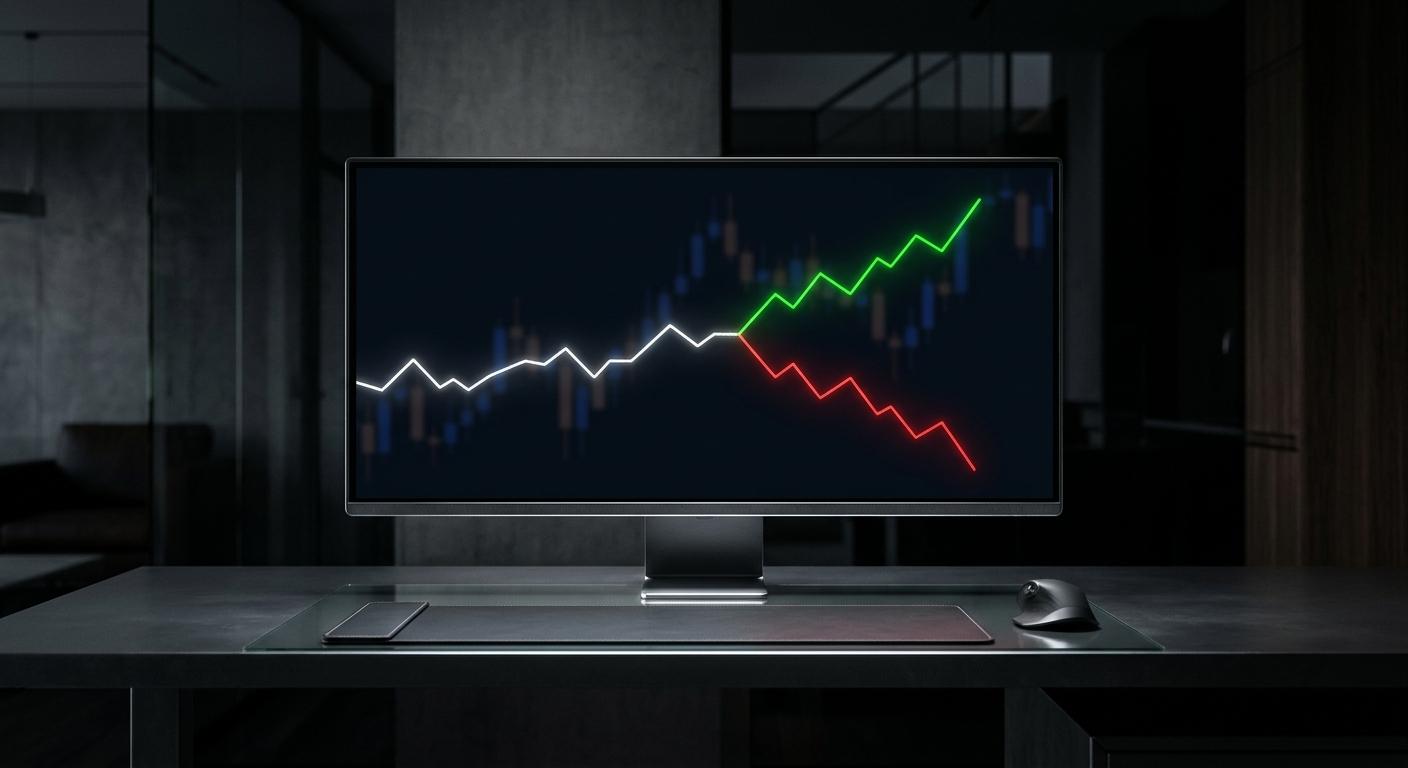
You buy a call on NVDA the morning before earnings. The stock moves your way the next day, up almost 3%, and the call is worth less than you paid. Nothing is broken, and the quote isn't wrong. You bought expensive implied volatility and it collapsed the moment the news came out.
Implied volatility is the part of an option's price that has nothing to do with direction. It's the market's estimate of how much a stock will move between now and expiration, expressed as an annualized percentage, and it can double your premium or halve it while the underlying barely budges.
For anyone trading options seriously, it sits alongside strike selection and timing as a core input, which is why it anchors our volatility guides.
What implied volatility actually measures
Implied volatility (IV) is a forward-looking number. It says: based on what people are paying for these contracts right now, the market expects this underlying to move roughly this much, annualized, in a one-standard-deviation range.
If AMD trades at $200 with 40% implied volatility, the market is pricing a one-year range of about plus or minus $80 (40% of $200), with roughly a 68% chance of finishing inside it. Nobody holds a one-year horizon on a day trade, so you scale it down. Divide the annual figure by the square root of the number of periods in a year:
- Daily expected move: IV ÷ 16 (there are about 252 trading days in a year, and the square root of 252 is close to 16)
- Weekly expected move: IV ÷ 7.2
- Monthly expected move: IV ÷ 3.5
So AMD at 40% IV has an implied daily move of about 2.5%, or $5 on a $200 stock. That single calculation tells you whether the move you're hoping for is ordinary or ambitious. If you need a 6% move in two days and the market prices 2.5% per day, you're not paying for a lottery ticket exactly, but you're paying for something the market already considers a stretch.
Importantly, IV has no sign. It doesn't predict up or down. A 70% IV reading on a crypto-linked stock like COIN says the market expects large moves in either direction.
Where the number comes from
There's no exchange that publishes implied volatility the way it publishes last sale. IV is reverse-engineered from the option's price.
An options pricing model takes six inputs: stock price, strike, time to expiration, interest rates, dividends, and volatility. Give it all six and it returns a theoretical price. Five of those inputs are known. So the model gets flipped: feed it the price the option is actually trading at, and solve for the volatility figure that makes the math balance. That output is the implied volatility.
That's why IV is better understood as a translation than a forecast. It converts dollars of premium into a standardized percentage so you can compare a $4.20 TSLA call with a $1.10 SPY put, or compare today's premium against last month's on the same ticker.
Two practical consequences follow. First, IV is a quote-driven number, so a wide bid-ask spread produces a wide IV range; always use the mid, not the ask. Second, every strike and expiration has its own IV. Out-of-the-money puts usually carry higher IV than equidistant calls on index products, a pattern known as skew, because demand for downside protection on SPX and SPY is structurally heavy.
Implied volatility versus historical volatility
Historical volatility (sometimes called realized or statistical volatility) measures what already happened: the standard deviation of past returns over a lookback window, usually 20 or 30 days. Implied volatility is what the market thinks comes next.
Comparing the two is one of the fastest sanity checks available.
Reading | What it suggests | Typical trade stance |
|---|---|---|
IV well above historical | Options are pricing more movement than the stock has been delivering | Premium looks rich; buyers need a bigger move to win |
IV close to historical | Expectations line up with recent behavior | No volatility edge either way; trade the direction |
IV below historical | Options are pricing less movement than the stock has been delivering | Premium looks cheap; long options get more leverage per dollar |
The gap usually exists for a reason. IV sits above historical before earnings, an FDA decision, a product launch, or a Fed meeting, because a known event is about to inject movement that the trailing window hasn't captured yet. The question isn't whether the gap exists but whether the coming event justifies it.
Why IV changes what your option is worth
The greek that measures this is vega: the change in an option's price for a one-point change in implied volatility.
Say a 30-day at-the-money call on META is worth $9.00 with a vega of 0.35 and an IV of 32%. If IV rises to 38% and nothing else changes, the option gains about $2.10 (6 points × 0.35). If IV falls to 26%, it loses roughly the same amount. On a contract that cost $900, that's a 23% swing with the stock unchanged.
Three things about vega are worth committing to memory:
- Vega is largest at the money. Deep in-the-money and far out-of-the-money contracts carry less volatility sensitivity.
- Vega grows with time. A 90-day option has far more vega than a 2-day option. Weeklies and same-day contracts are nearly immune to IV changes but brutally exposed to time decay.
- Long options are long vega. Every bought call and bought put profits from rising IV and suffers from falling IV. Sold premium is the reverse.
That last point matters a great deal if your account only permits long contracts. On a long position, falling IV is a headwind you fight on top of theta.
IV rank and IV percentile
A raw IV number means nothing on its own. Is 45% high? On SPY, extremely. On MSTR, it's a quiet week. You need context, and two measures give it.
IV rank compares current IV to the 52-week high and low:
IV rank = (current IV − 52-week low IV) ÷ (52-week high IV − 52-week low IV) × 100
If PLTR's IV has ranged from 40% to 100% over the past year and currently sits at 70%, the IV rank is 50. Halfway.
IV percentile tells you what share of the past year's trading days had IV lower than today's. If PLTR's IV percentile is 85, then IV has been lower than this on 85% of days over the last year.
Percentile is usually the more honest of the two, because a single volatility spike can anchor the 52-week high and depress IV rank readings for a year afterward. Either way, the rule of thumb holds: low readings favor buying premium, high readings favor selling it or at least structuring trades that aren't purely long vega.
The VIX and index volatility
The VIX is the best-known implied volatility measure in the market: a 30-day forward estimate of S&P 500 volatility derived from SPX option prices. Cboe publishes the methodology and the live value on its VIX product page.
Readings below about 15 describe calm markets where index options are cheap and long premium strategies struggle to outrun decay. Readings above 25 usually accompany selling, and above 35 you're in genuine stress, where even correctly predicted direction can lose money if you bought in at peak panic and volatility normalizes.
Two useful habits: check the VIX before you take an index trade on SPY, QQQ or XSP, and remember that single-stock IV generally rises when the VIX rises. Correlation goes to one in a selloff, and so does implied volatility.
IV crush
IV crush is the sharp drop in implied volatility immediately after a scheduled event resolves.
The mechanism is simple. In the days before an earnings report, demand for options rises and market makers raise prices to cover the gap risk. Implied volatility on the front expiration might climb from 45% to 95%. The report comes out at 4:05 p.m. ET, the uncertainty is gone, and by the next open IV on that expiration has fallen back toward 45%. Every long option on the chain loses that vega premium at once.
This is why a correct directional call can still lose. If HOOD is priced for an 8% move and delivers 4%, the long call buyer who was right about direction still loses, because the gain from the move is smaller than the loss from the volatility reset. The breakeven for an earnings trade isn't the strike plus the premium; it's roughly the implied move the market already charged you for.
Ways traders deal with it:
- Take the directional trade before the IV ramp rather than the day of
- Close long options into the run-up, selling the volatility expansion rather than holding through the event
- Use longer expirations, where the post-event IV drop is proportionally smaller
- Trade spreads, where the short leg offsets part of the vega on the long leg
- Simply sit out the event and trade the trend that forms afterward
Trading around IV instead of ignoring it
Once you're tracking volatility, position selection stops being guesswork.
When IV is low, long premium gets attractive. A long call or long put costs less, so the same directional view needs a smaller move to break even, and any volatility expansion works in your favor. Cheap IV also means you can buy more time, which is usually a better use of money than buying a closer strike.
When IV is high, buying outright gets expensive and the odds shift. This is where premium sellers show up: a short put collects inflated premium and profits from the volatility reset, and a short call does the same on the upside. Defined-risk structures like the iron condor are built for exactly this condition, collecting on both wings and benefiting as IV falls back.
When IV is average, volatility is noise rather than edge. Trade the direction, keep expirations reasonable, and don't pay up for the convenience of a nearby strike.
If options are still new to you, the mechanics in our options trading guide for beginners give you the vocabulary these decisions rely on.
Mistakes that cost money
Treating high IV as bullish. It isn't directional. Elevated IV often shows up in falling markets, since fear prices higher than greed.
Buying the cheapest contract on the board. Far out-of-the-money options on a high-IV name look affordable because the market considers them unlikely. The low price is the market's probability estimate, not a bargain.
Ignoring the term structure. The front-week expiration can show 80% IV while the monthly shows 40%. Averaging them in your head leads to buying the wrong expiration.
Forgetting that IV is per strike. Pulling the at-the-money IV and applying it to a deep out-of-the-money put ignores skew, and skew is largest exactly where retail traders like to shop.
Frequently asked questions
Is high implied volatility good or bad?
Neither on its own. It's good if you're selling premium, because you're collecting more for the same risk. It's bad if you're buying, because you're paying more and will lose value when IV normalizes. What matters is whether the current level is high relative to that ticker's own history and whether a real event justifies it.
What is a normal implied volatility level?
It varies enormously by underlying. Broad index products like SPY often sit in the teens to low twenties. Large-cap tech names like AAPL or GOOGL commonly run 25% to 40%. High-beta names such as MSTR or a volatile AI stock can hold triple digits. Compare a ticker to itself using IV rank or IV percentile rather than to some universal number.
Does implied volatility predict direction?
No. IV measures expected magnitude. A reading of 60% says the market expects large moves, not upward moves. Skew (the difference in IV between puts and calls) carries a faint directional signal about where hedging demand sits, but IV itself is direction-neutral.
How do I avoid IV crush?
Don't hold long options through a scheduled event you've already paid for. Enter before the volatility ramp and exit into it, pick an expiration far enough out that the post-event reset is a smaller share of the premium, or use a spread so a short leg offsets some of the vega.
Where can I see implied volatility on an options chain?
Most platforms show an IV column alongside the bid, ask and greeks for each strike, including DxTrade. If yours doesn't display it by default, it's usually a column setting. Mid-price IV is more reliable than IV calculated from the ask.
Does IV affect every option the same way?
No. Vega is highest for at-the-money contracts with more time to expiration. A 60-day at-the-money call reprices substantially on a volatility shift; a same-day out-of-the-money contract barely registers it and is driven almost entirely by delta and time decay.
Implied volatility is the input most new options traders skip and most consistent ones check first. Once you know whether you're buying cheap movement or expensive movement, the rest of the trade, strike, expiration, and size, gets easier to decide. When you're ready to put that into practice on a funded options account, compare the Vanquish plans and pick the one that fits how you trade volatility.